A nine-signal, live Databox dashboard that gives sales and marketing a shared, quantitative view of where messaging loses deals, so you fix the right stage first.
Powered by Databox
Sales and marketing keep having the same argument.
Because they’re looking at different numbers, and nobody can prove where the problem actually lives.
When deals stop closing the way they should, most teams debate messaging, positioning, and ICP fit without a shared quantitative view of the funnel. Every quarterly review relitigates the same questions. The real problem stays hidden.
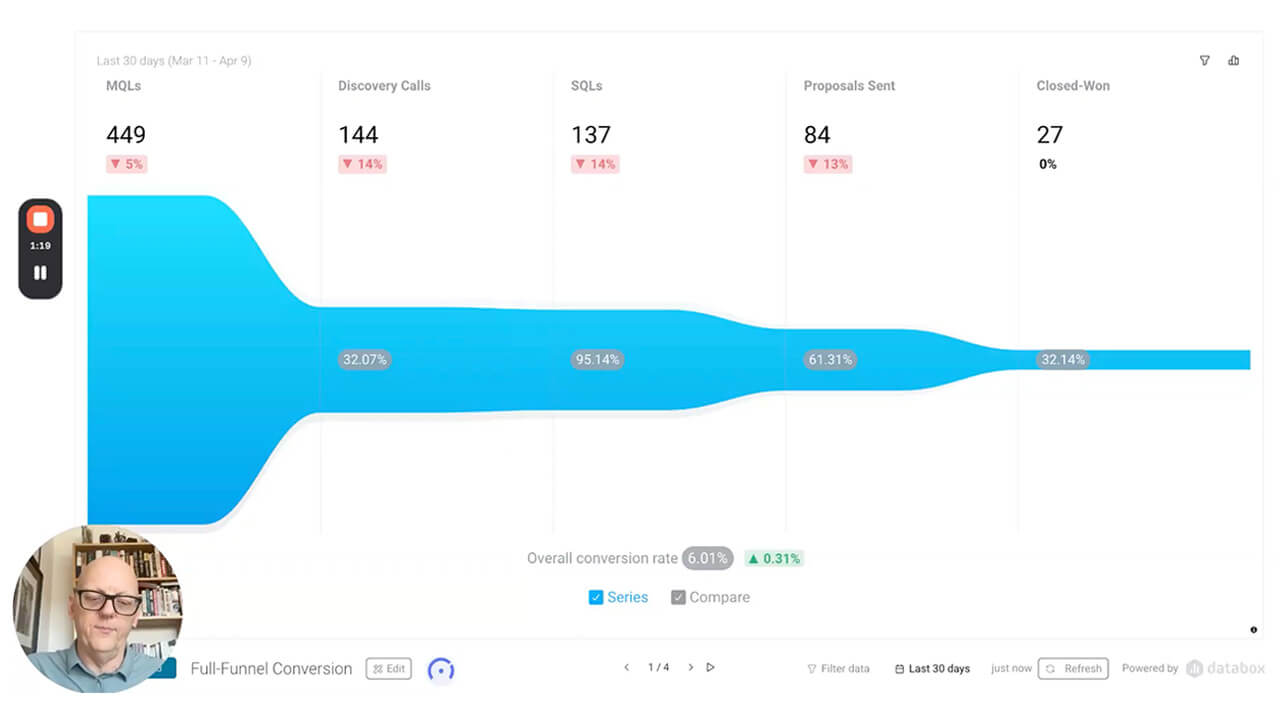
The fix: A live, nine-signal Stand Out Messaging Audit dashboard that shows sales and marketing exactly which funnel stage is breaking — and what to prioritize first.
- Traffic is strong but conversions don’t happen, and no one agrees on why
- Sales is booking demos but qualifying fewer than 30%, a signal hiding in plain sight
- The same objections keep coming up on discovery calls, but nobody’s tracking which ones
- Proposals go quiet: without data on whether it’s price, proof, or differentiation
- Every QBR (Quarterly Business Review) is a debate instead of a diagnosis
Three ways The Write Way, Inc. delivers the audit
Every engagement is built on the same nine-signal framework that’s customized to your data, your funnel, and the stage where messaging is actually breaking down.
Messaging Audit Dashboard
Your nine signals, live in Databox. Sales and marketing finally looking at the same numbers — with red flags surfaced automatically before the next pipeline review.
- GA4, HubSpot, and CRM connected in one view
- Three funnel stages, three metrics each
- Threshold alerts so problems surface early
- Set up in two weeks, no IT required
Diagnostic Strategy Session
A 90-minute working session using your live dashboard to pinpoint which stage to prioritize — and what the highest-leverage change is right now.
- Walk through all nine signals with your team
- Identify whether the problem is upstream or downstream
- Leave with a prioritized fix list, not a long slide deck
- Recording included for async review
Ongoing Messaging Intelligence
Monthly dashboard reviews that track whether the changes you made are actually moving the signals, so you’re not running experiments blind.
- Monthly cadence with Paul directly
- Live Databox dashboard updated continuously
- Objection frequency tracking across your sales calls
- B2B SaaS benchmark comparisons
Nine signals. Three funnel stages. One shared view.
The audit doesn’t just tell you messaging is failing. It tells you exactly where. And it gives sales and marketing a shared quantitative language for fixing it together.
Stage 1 — Traffic → MQL
Offsite messaging effectiveness — is your hook earning attention and converting it?
- Click-through rate by channel — Flag: <1% paid
- Engaged session rate — Flag: <40%
- Content-sourced MQL rate — Flag: low vs. traffic volume
Stage 2 — MQL → SQL
On-site messaging effectiveness — is your proof landing once people arrive?
- Demo meeting request rate — Flag: <3%
- High-intent page conversion — Flag: <5%
- MQL→SQL conversion rate — Flag: <30%
Stage 3 — SQL → Opportunity
Sales conversation effectiveness — is your narrative creating urgency and closing?
- Discovery to proposal rate — Flag: <50%
- Proposal to close rate — Flag: <25%
- Objection frequency by type — Recurring patterns = upstream messaging gap
You don’t need more general dashboards. You need business intelligence with a purpose.
Built by a practitioner
Paul has run this audit on real B2B companies. The benchmarks come from patterns rather than theory.
Connects your actual tools
GA4, HubSpot, Salesforce, and more — all pulled into one view via 130+ native Databox integrations.
Sales + marketing aligned
Both teams see the same numbers. Diagnosis replaces debate. Quarterly reviews become working sessions.
Two-week setup
No IT involvement, no long implementation. Connected and running quickly, then yours to keep.
Prioritized, not overwhelming
Nine metrics tell you exactly which stage to fix first. You don’t have to chase everything at once.
Strategy, not just reporting
Every review session is a working conversation about what the numbers mean — not a data dump.
From intro call to live dashboard in four steps
Step 01 — Discovery Call
We map your current funnel, confirm which data sources you have, and agree on the metrics that matter for your specific go-to-market.
Step 02 — Connect Your Data
GA4, HubSpot, your CRM — connected to Databox with no IT team needed. Most setups take a few hours.
Step 03 — Build the Audit Dashboard
Your nine-signal Messaging Audit goes live. Thresholds are set, red flags configured, and both teams get access.
Step 04 — Review & Prioritize Together
We walk through the dashboard with your sales and marketing leads, identify the priority stage, and build the fix roadmap.
Stop guessing which stage is broken.
Get a free competitive messaging audit and we’ll show you the nine-signal framework using an example from your funnel.
